Environmental Modeling


Original Project Proposal
My original project idea was to attempt to understand the spread of Panama Disease across and between banana plantations in Jamaica. My first research question was “What are the key factors driving the likelihood of Panama Disease infecting a banana plantation?” Within this larger question, some of the sub-questions I wanted to explore were what soil properties impact the likelihood, how climate (rainfall and temperature) impact the disease’s spread, and what the role of space is, from proximity to other plantations, proximity to water, and proximity to railways.
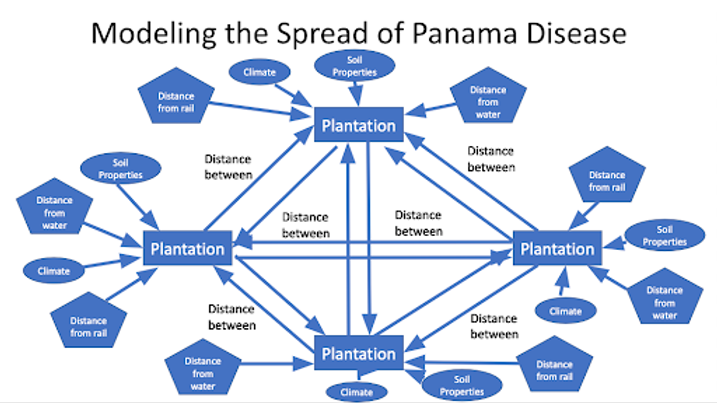
I envisioned my model simulating a plantation complex (see below image). I planned to start with four or five plantations on the island as my state variables. From there, I would input into each plantation values for soil, climate, and distances from water, railways, and the other plantations. I hoped that creating this plantation complex would allow me to model how the disease could spread from plantation to plantation on a small scale. Were I able to get the model to work at the scale of four or five plantations, I would then be able to expand it to incorporate more plantations.
Revised Project Proposal
Within a few weeks it became apparent that I did not have the necessary data or experience to follow through on my initial project proposal. Instead, I chose to focus on one specific variable, temperature, to see how different temperatures impact the rate at which the roots of a banana plant become completely colonized by the fungus that causes Panama Disease. I hypothesized that as temperature increases, the rate at which Panama Disease infects a plant increases, thereby decreasing the warning time planters have to quarantine infected plants. I further hypothesized that banana growing areas at higher altitudes will become infected at a slower rate due to decreased temperatures in these areas.
Jamaica has distinct geographic areas, based largely around the mountains on the island, particularly the Blue Mountains. Therefore, I selected five locations within Jamaica at varying altitudes to use as the comparative basis for my climate model. Additionally, for a point of comparison, I selected the primary banana growing region in Ecuador as a sixth location to see how the climate of Jamaica compared to the world’s leading banana exporter in terms of suitability for Panama Disease growth.

Using R for Environmental Modeling
In order to model the rate of Panama Disease growth within a banana plant, I used equations taken from “Linking Plant Disease Risk and Precipitation Drivers: A Dynamical Systems Framework (Thompson, et al. 2013). Thompson created what she describes as a “simple model of Pc infection in a plant root system based around root volume, the rate at which pathogen extent increases, the rate of root regeneration, temperature, and the ratio of infected versus uninfected roots. The resulting models showed the amount of time in days it takes for the roots of an infected plant to become completely infected by a fungal pathogen. The differential equation used to show the development of disease within plant roots takes the form:
db/dt = b(rW) - m) - (b/v)n.
To obtain the values needed for the equations, I combined research Thompson conducted on pathogen growth in the southwestern United States (Thompson, et al. 2014) with characteristics of banana plants. For the root regeneration (m), I used, as did Thompson, an assumed value of m = 0.1. In the equation, n is used as a constant for computational purposes and was set at n = 100. The volume of a banana plant root (v) was set based on prior research into banana root systems (Lecompte, et al. 2005) with a value of v = 15. In this equation, b accounts for the amount of the root volume that is colonized by a fungal pathogen. For this model, I worked under the assumption that the banana plants were just infected with Panama Disease, but that it did not have time to spread and grow yet. Therefore, I set the value of b at b = 0.1. The way that the effects of temperature enter the equation is through calculating the rW value, the rate at which the pathogen spreads. Because no research has yet been done specifically on bananas in terms of pathogen growth rate in roots, I used the equation provided by Thompson to calculate the rW value, which took the form:
rW = -0.1122 + 0.023T where T accounts for a given temperature.
To obtain the temperature data for each of these locations, I used the MarkSim DSSAT weather file generator, a web based Markov model tool that predicts the temperature and rainfall amounts at specific locations on a daily basis through the year 2100 (http://gismap.ciat.cgiar.org/MarkSimGCM/). To see temperature change over time for each of the six locations and how this could impact the speed of fungal growth, I selected the years 2020, 2050, and 2080 to be simulated for this study. The resulting temperatures after running the model can be seen in the below table. To ensure some variability within the temperatures, I obtained the minimum and maximum temperatures for each location for the given years and used each range to make the temperatures used in the model stochastic rather than fixed.

Project Output


Analysis and Reflection
The model results show variation in the rate at which a plant’s roots become colonized by Panama Disease in terms of both space and time. Looking first at the low altitude locations (Portland, St. Mary, and Westmoreland), in 2020, each of these locations shows exponential growth of the pathogen beginning around day 11 and ending around day 12. For the year 2050, the three separate slightly, with St. Mary and Westmoreland plants beginning growth by day 10 and reaching maximum volume by day 11. Portland in contrast remains nearly the same as in 2020, except for reaching maximum growth slightly faster. For 2080, Portland and St. Mary’s exponential growth shift several days earlier, beginning by day 8 and ending by day 9. Westmoreland remains roughly the same as it was in 2050, beginning by day 10 and ending by day 11, albeit slightly earlier in day 11 than in 2050.
In contrast, the high-altitude locations in St. Catherine and the Blue Mountains show a slower rate of spread than the low-altitude locations. In 2020, exponential growth does not begin in the Blue Mountains until day 15 and ends on day 16. In St. Catherine, exponential growth starts on day 16 and ends on day 18, which is 5-6 days slower than in the low altitude locations. In 2050, root colonization takes place significantly earlier, beginning in day 10 and ending in day 11 in both St. Catherine and the Blue Mountains. The projected growth for 2080 is nearly identical to that of 2050. As a point of reference to the five Jamaican locations, Los Rios, Ecuador in 2020 shows the same pathogen spread rate as the lower altitude locations, but for 2050 and 2080, shifts several days earlier, with exponential growth beginning in day 7 and reaching maximum volume in day 8. The results of this study suggest that due to a lower and wider range of temperatures, banana cultivation in higher altitudes offers more time to notice and therefore quarantine infected banana plants than those grown in lower altitude areas, supporting my initial hypothesis. Additionally, they show a degree of urgency in genetically engineering a Panama Disease-resistant variety of banana. In every location examined, the results for 2050 and 2080 show a sped-up process of infection of the plant root.
However, these findings should be viewed more as a proof of concept than something with cemented conclusions. There have been no specific environmental modeling projects based around Panama Disease, so the list of assumptions I had to make to adopt differential equations used for other disease spread models was very long. It would take me significantly more time to determine the validity of some of these models for cross-species analysis than was possible in the confines of a one semester class while I was simultaneously learning a new programming language and what environmental modeling was in the first place. I also found few environmental modeling projects that are historical in nature, which is unsurprising given the traditional uses for contemporary and future concerns. I did not know how to make these models work for a historical project, so I used my project to look forward to potential spreads of Panama Disease in the future. I found that the more I dove into the project, the further afield I went from my own research interests into Afro-Jamaican smallholder agriculture in the context of Panama Disease spread. I came away from the class skeptical that environmental modeling would be an asset to helping me tell this particular story.