Dissertation Maps
Below are the various maps I created as part of my dissertation. I have added them chronologically as they appear in the dissertation. I have included a brief description of the maps for each section.
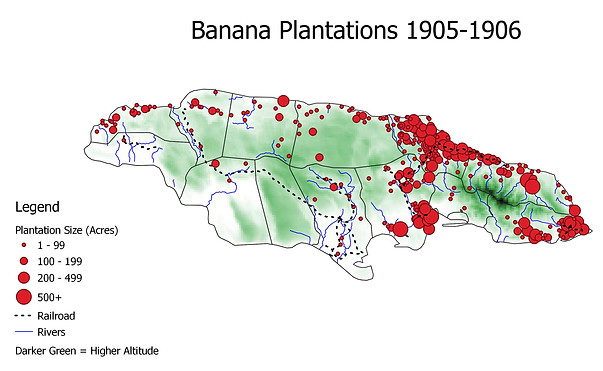
Late-Nineteenth Century Banana Cultivation

I used this map to highlight the main locations for the cultivation of gros michel bananas in the late-19th century. The cultivar was primarily grown along flat river valleys with rich, alluvial soil in the northern and eastern parishes. The main banana growing parishes in the 1890s (seen in the darkest green) were Portland and St. Mary. The western parishes remained primarily devoted to sugar cultivation.
Banana Plantation Growth in the 1890s


These maps highlight the rapid expansion of banana plantations in the 1890s. In the early years of the Jamaican banana trade, which began in the 1870s, the trade was led by smallholders cultivating bananas on their farms made of a few acres of land. However, as the trade expanded, more planters began seeing value in the banana trade and trading companies, such as the Boston and eventually United Fruit Company, began buying land to cultivate their own bananas. By 1900, 74% of the island's bananas were grown on plantations.
Boston and United Fruit Company Plantations


Used in tandem with the previous maps, these two maps show the efforts of the Boston and United Fruit Companies to expand their holdings in Jamaica. In 1899, the Boston Fruit Company merged with a Central American banana company to form the United Fruit Company. These maps show how UFCo quickly expanded its Jamaican holdings within the first several years of its existence and also expanded the geography of banana cultivation into the island's southern parishes, particularly St. Catherine.
Early Panama Disease Spread


These maps highlight the role of rivers and railways in facilitating Panama Disease spread in the first decade of the outbreak. The two areas circled, in St. Catherine and Clarendon, had both rivers and rail lines pass through them. In St. Catherine in particular, the region of Bog Walk served as one of the parish's primary rail stations and was near the meeting point of the Magno, Cobre, and Pedro rivers. Additionally, the nearby Linstead Market was one of the largest markets in the area, with buyers and sellers traveling for miles to reach it. These maps led me to further analyze the role of banana trash in facilitating disease spread.
Change in Banana Plantations 1906-1931

These maps highlight the changes and continuities in plantation-based banana production between 1906 (5 years before the discovery of Panama Disease on the island) and 1931 (20 years after the discovery). The maps show that apart from an abandonment of large plantations in Portland, the geography of banana plantations changed little from pre-Panama Disease times to 1930. The primary areas of growth occurred in the western parishes of St. James and Hanover along both the Great River and the rail lines, as well as in St. Elizabeth within the Vere plains and along the rail line. The change in proportion of banana acreage by parish echoes this data, with no parish showing more than a six percent increase or decrease in proportion of total banana acreage between 1905 and 1930.
United Fruit Company Shifting Agriculture


These maps accompany the prior maps and examine the shifting agriculture that did take place during the 1906 to 1931 period. In 1906, the center of United Fruit production in Jamaica was centered in Portland around Port Antonio, but by 1931, this center shifted to the southern coast of Jamaica, in both Clarendon and St. Catherine. UFCo constructed a pier in Kingston’s harbor in 1921 to accommodate the relocation of much of their production to the southern parishes. By 1935, United Fruit would completely abandon any efforts at cultivation in Portland due to the spread of Panama Disease in the parish.
Revival of the Sugar Industry


The above maps highlight the geography of expanded sugar production in the late 1910s and early 1920s. This period saw the expansion of smallholder sugar production for export as a result of higher prices brought about by World War I and concerns over the stability of banana cultivation. Unlike the previous geography of sugar, which was primarily based in the western parishes, this expansion of sugar production took place across the island, especially in many heavy banana producing parishes such as St. Catherine.
Central Sugar Factories and Cane Farmers

This map shows the geography of central sugar factories in Jamaica and the range within which farmers nearby to the factories would sell their cane to be processed. The circles surrounding the factory locations represent a five mile radius. In 1944, 70% of cane farmer sugar was grown within five miles of central factories. Creating these buffer zones allowed me to see what this radius looked like in terms of Jamaica's overall geography.