DSAM Capstone
Project Proposal
As with many of my previous DSAM courses, my Capstone experience was based around several different projects. The three projects I focused on were creating and refining maps for my dissertation, looking into the possibility of creating a companion website for my digital work, and reflecting on and creating pedagogy based around tools drawn from the Digital Humanities. Combining all of these into one theme, I would say my overall focus was based around best ways to present digital tools and projects to a variety of audiences.
Project One: Finishing Dissertation Maps
I ended up creating fourteen GIS maps for my dissertation. All of these maps fell into one of two buckets: examining specific locations and acreages of banana and sugar plantations or choropleth maps showing parish-by-parish changes in banana or sugar production. All of these used the same Jamaica basemap. Reflecting on the value of these maps to my project, I feel that the maps that led me to a further analysis of banana trash were the most useful to my overall project. These pushed my research forward in ways that I don’t think I would have gotten to without them. The other maps were useful for my project, such as for seeing who was able to practice shifting agriculture and at examining different geographies of sugar and banana cultivation, but these did not move my research forward in the same way that the banana trash maps did.
I contemplated making several additional maps that looked at the severity of disease spread across parishes, the decline of sugar plantations in the 19th century, and banana and sugar production in the 1930s and 1940s. However, once I started to gather the data for them I realized that charts would convey the data much more effectively and efficiently than a GIS map would. I felt that I would just be making maps for the sake of making maps. Click "See More" below to view all of my maps.
Project Two: Companion Website?

In addition to the continuous map-making, I spent the first part of the semester trying to build a companion website for my digital tools. I had never built a website before, nor did I know the first thing about website design, so I was largely starting from scratch. The goal I had in mind when I started was for the website to host all of the digital projects I created for my dissertation, serve as the basis for my portfolio, and be something that I could easily turn into a personal website that I could use for the job market. I quickly learned that this was too many things.
I spent several weeks experimenting with different website hosting platforms and determining their viability for my project. I ended up choosing Wix based on the variety of tools that were available for free, ease of use, and my overall enjoyment of its design process. Once I settled on the platform, I spent a significant amount of time trying to create a timeline slider that I could use for my maps to easily show change over time. I came away largely dissatisfied with all of the available options and eventually settled on a slideshow presentation format for each of the projects.
With these design details seemingly sorted, I began figuring out how much text to include to accompany the maps, which is where the issues with the concept of a companion website for my maps became very apparent. The maps require a significant amount of context to understand why they were created and what purpose they served in the larger narrative. The maps themselves have minimal standalone value. This realization coincided with the first presentation I had to give in Capstone, and based on the feedback from that presentation, I decided that a companion website would not be a useful tool for my particular project. I was trying to create a “one size fits all website” that served the purpose of companion, portfolio, and personal website. Without a clear reason for being that specifically focused on one of these components, the website would just be a jumble of ideas more so than anything coherent. The companion aspect also wasn’t advancing my research in any meaningful way or adding value to the maps themselves. Because of this I decided to focus the website building around my digital portfolio, the results of which you are currently viewing.
Project Three: Digital Tools in History Classrooms
Following my struggles with the website, I decided to focus my attention on the use of digital tools and methods in the classroom. I had done some previous thinking about this, with some successful and unsuccessful attempts in classes I previously taught, so I felt that this would be a useful exercise to help me further develop my own pedagogy. One of the areas I focused on was the value of ESRI StoryMap and StoryMapJS in a classroom setting. I created a “US Intervention in Latin America and the Caribbean” StoryMap that I tried to use in my Modern Latin American History class, but I did not feel that I used it well. I tried to use the lecture to walk students through the map, which I imagine was extremely difficult to follow. Reflecting on this experience and exploring more in StoryMap, I reached the conclusion that if I were to use more StoryMaps that I create, I would treat them as assigned readings that let students explore, or set aside class time for them to do this. Using them as sources for discussion rather than as lecture tools would be a more effective use. But you also have to consider whether the work that would go into making these is worth it versus just having students read about them in traditional texts.
I also reflected on and started developing an undergraduate “History of Disease” course that would have students use a Story Map to create a narrative of disease spread across time and space. This would have to be an advanced undergraduate course, along the lines of what the World History Center offers through its Digital Atlas Design Internship. The crux of the issue with designing a class with this sort of assignment is how much discussion should be put into the theory of Digital Humanities and how much instruction students should be given about how to make the Story Map. It is hard to find the balance between letting students discover the uses of the tool on their own but presenting enough information that they don’t feel that there is too high of a barrier to entry. On the other hand, you don’t want to provide the students a step-by-step guide, as they will just be repeating what you tell them to do, which has limited analytical value. I admittedly have not made much progress in figuring out solutions to these issues, and it is probably likely that this course never comes to fruition. But at the very least, it has helped me to think through the challenges that come with incorporating digital tools in the classroom.
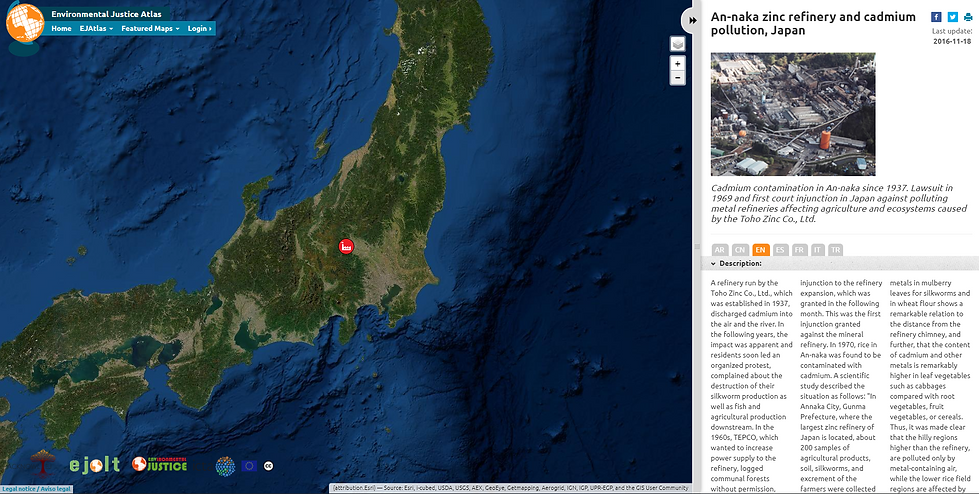
The work I was most pleased with throughout my pedagogical work was on creating individual modules based around digital tools. In particular, I created a module for a World Environmental History class session on environmental justice based around the Atlas of Environmental Justice. The EJAlas is a digital platform that shows thousands of different conflicts over the last few decades based around environmental issues. It operates similarly to a gazetteer, providing basic information about these conflicts but also linking to more stories and details if you wish to further explore an individual conflict. I created a class module around the atlas where students explore a conflict of their choosing, discuss it in small groups to learn about other conflicts, and then have a full class discussion where we cover similarities and differences in conflicts across time and space and identify specific themes and takeaways based on this exploration. For me, this was the most exciting use of a digital tool that I created and I plan to design modules based on other pre-existing spatial history projects that sites such as the Stanford Spatial History Project offer.